Tracking NYC's Weed Bodegas
We’re bringing you some of our most interesting stories about the state of US Business we’re seeing with Enigma data, as the data that’s caught our eyes lately as we’ve been building Enigma’s next generation platform, and sometimes a few tidbits of product news.
This month’s big story: we’re looking at the rise and fall of illegal weed bodegas in NYC through the revenue impact of an enforcement crackdown on their legal counterparts.
Weed Bodegas of NYC
Where the revenue tells the story.
If you’ve walked down the street in New York City over the past few years, you’ve probably noticed it: illegal weed shops are everywhere.
On blocks with commercial storefronts, it seems like there’s one–often several–store(s) selling cannabis without a license. Some are self-styled membership clubs, others occupy former bodegas and also sell candy and snacks, while some are weed-only shops with a hulking security guard and a welcoming “No Ski Masks Allowed” sign at the door.
What they all have in common is that they don’t have licenses to legally sell what they’re selling.
These grey-zone weed shops sprung up because four years ago, New York state’s 2021 marijuana legalization law created a clunky licensing process that delayed fully legal shops from opening, creating additional consumer demand without commensurate supply, while failing to clearly lay out who was responsible for shutting down unlicensed commercial vendors.
After a tweak to state law last year cleared up the enforcement confusion, New York City massively ramped up enforcement with a plan called Padlock to Protect. That revenue boost appears to be continuing, despite a legal challenge to the city’s enforcement program being successful (the City has said it will appeal the ruling and continue locking unlicensed shops).
Revenue data analyzed by Enigma shows that Padlock to Protect had a significant impact on legal weed sales, a clear indication that the program shuttered enough unlicensed stores that it pushed consumers to increase purchases from fully state-licensed vendors.
While both the total revenue and number of legal dispensaries continued to grow each month through the life of the program, there’s a noticeable jump in revenue from May 2024 to June 2024, just as enforcement ramps up.

And that change is really something when you look at the monthly change in revenue per store: even as the number of stores grow there’s a 45% jump in per-store revenue.
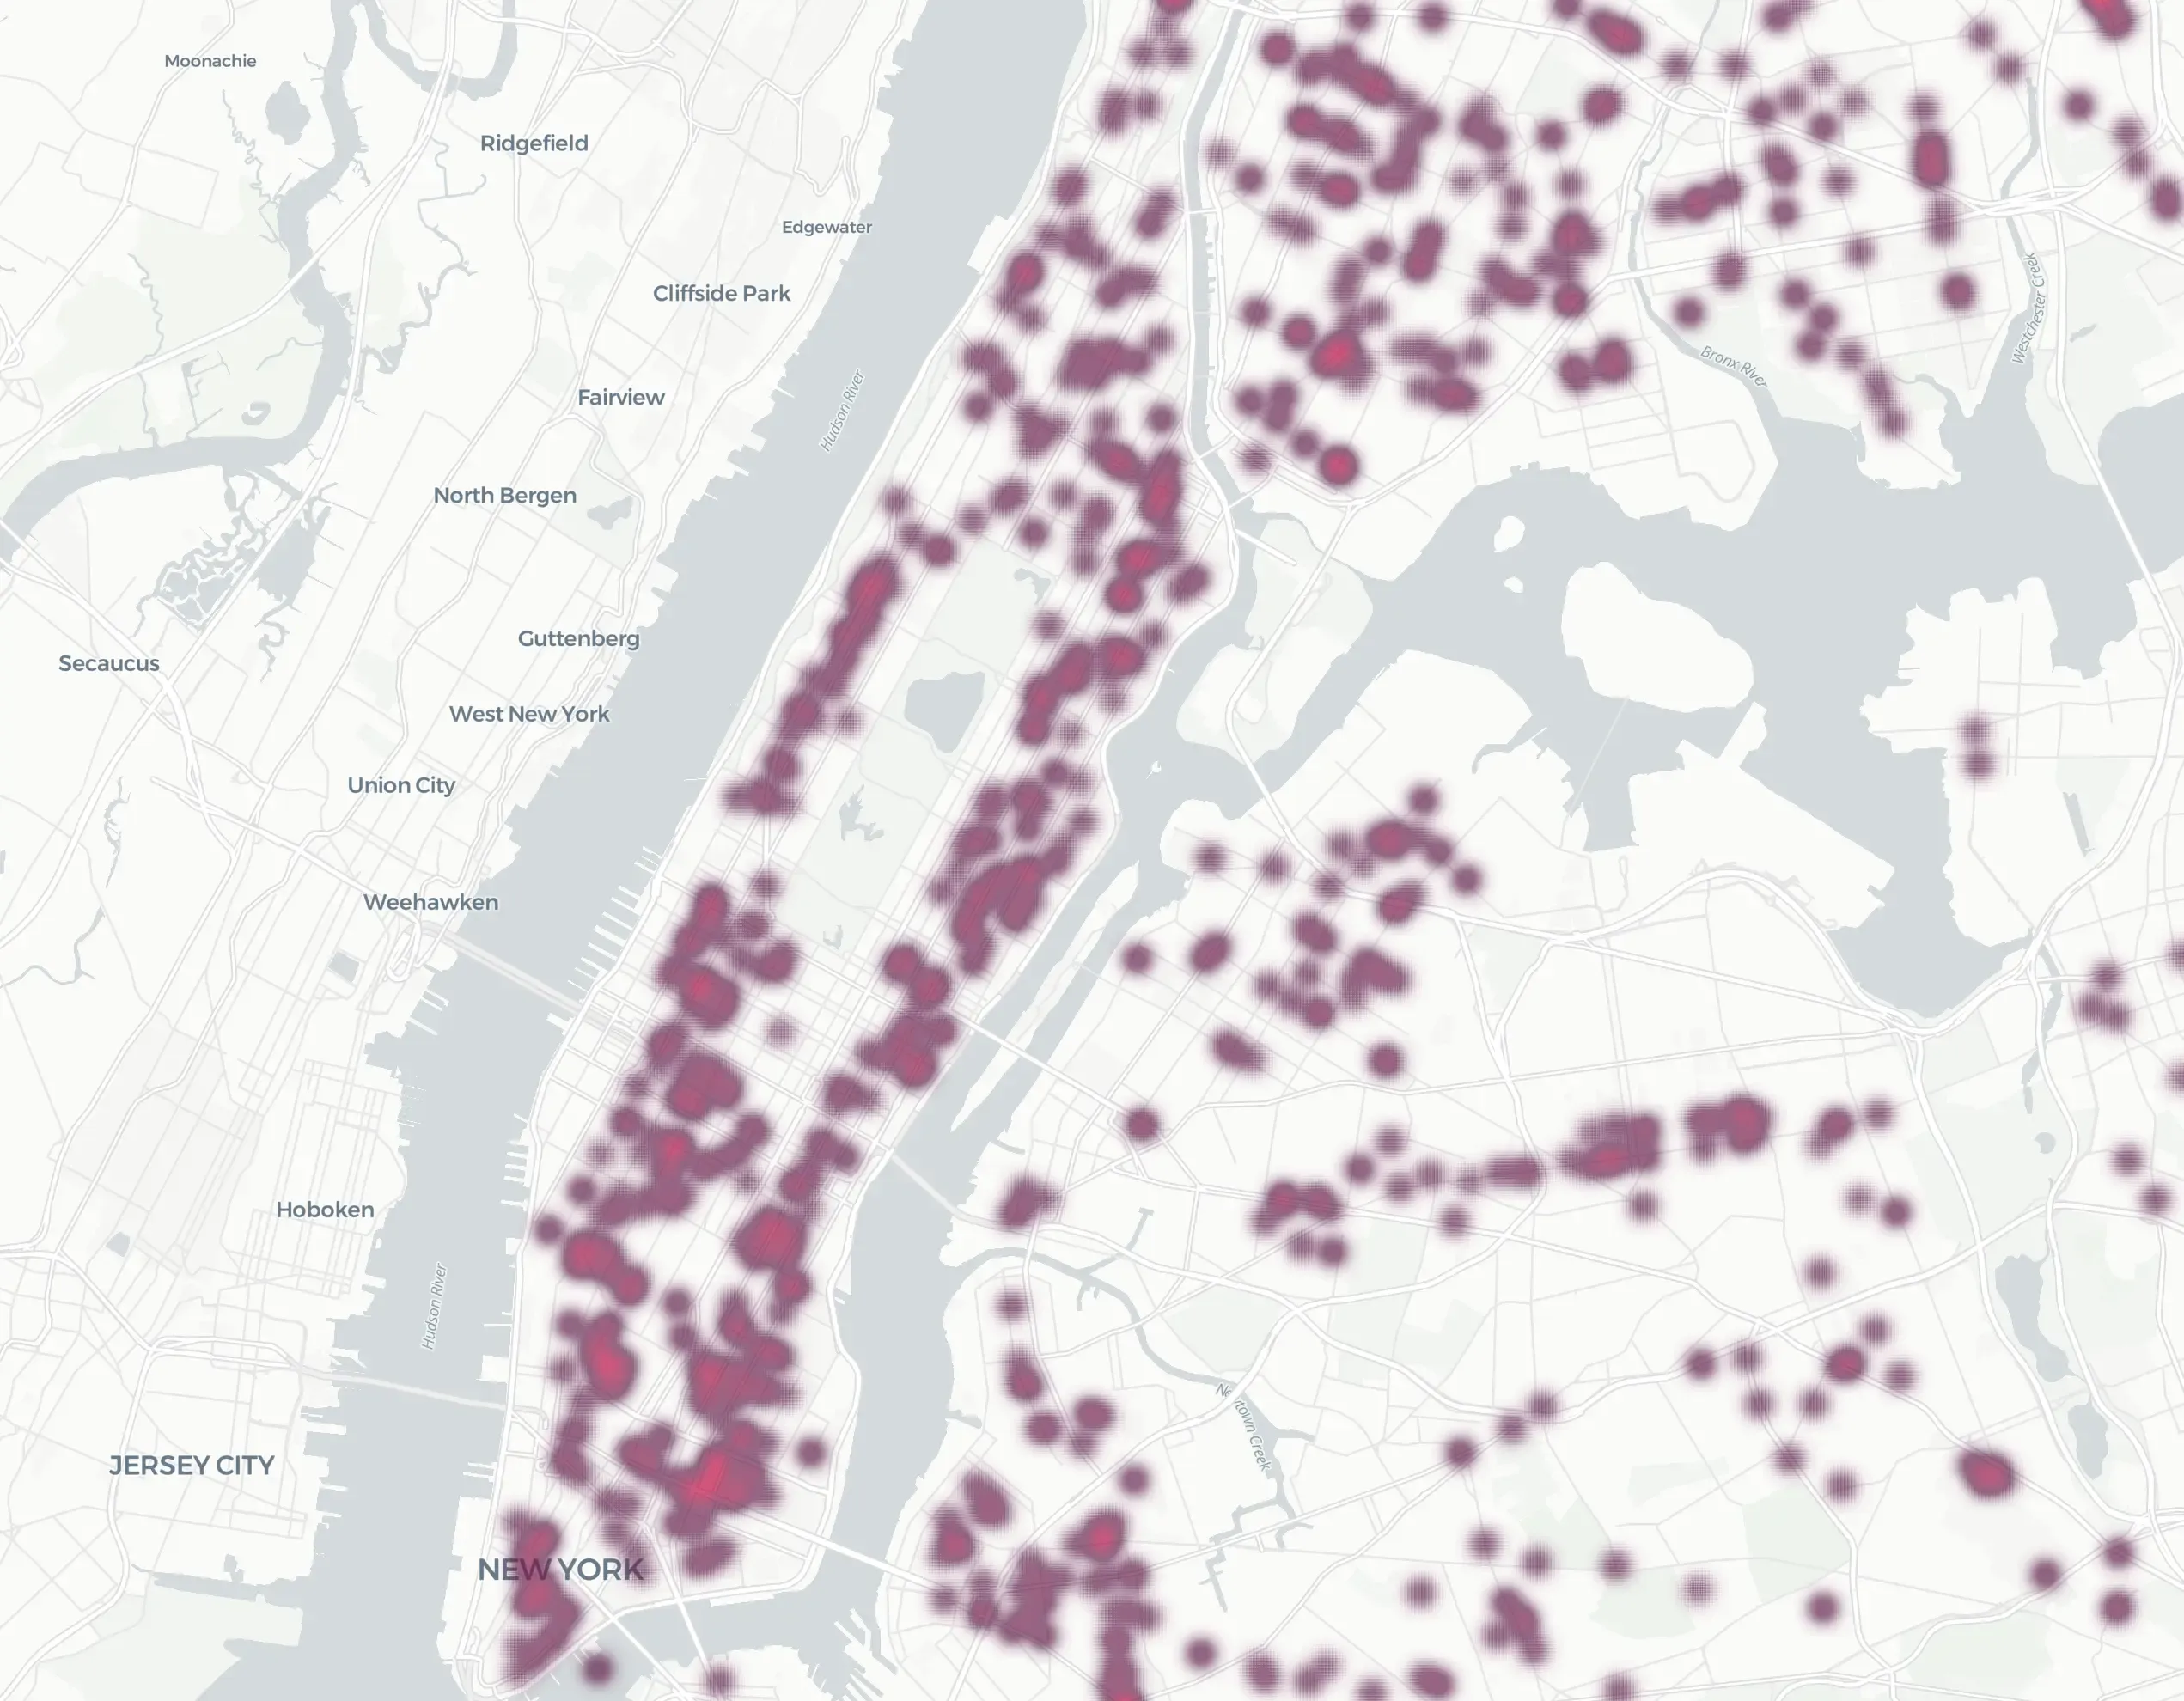
Meanwhile, we’re still getting the full picture of what that enforcement campaign looked like. Data obtained by Enigma from New York City also shows that the city’s enforcement from May through August was heavily focused on Manhattan, with a high concentration of raids on the Upper East Side, the Upper West Side, the Lower East Side and the East Village:
This heatmap displays inspections/raids done by the NYC Department of Consumer and Worker Protection and the New York City Sheriff’s Office as part of Operation Padlock to Protect between May 2024 and August 2024; data for inspections/raids done by the Sheriff’s Office alone as well as those performed between September and December 2024 are not available.
Really makes you want to know who you’re doing business with. Enigma’s here to help you with exactly that!
Lets check-in on some datapoints:
- The average price of a dozen eggs is up 7x from two years ago - U.S. Dept. of Agriculture
- The Ford F150 Lightning boom is definitely over - Bloomberg
- Hurricanes are killing in new ways, as freshwater flooding rises - NY Times
- Who buys from AliExpress, Temu, and Shein? Disproportionately, low-income Americans - NBER
- Climate-induced shortages have caused cocoa prices to surge nearly 50% since Halloween - Trading Economics