Slice Slice Baby
We examined thousands of pizza ratings and tracked their impact through revenue, foot traffic, and geography.
It’s a simple premise: rate pizza on a scale of 1 to 10, film it in 90 seconds, post it online. Launched by Barstool Sports founder and self-appointed “El Presidente” Dave Portnoy, OneBite Reviews has turned this formula into one of food media’s most influential platforms, with thousands of restaurants receiving numerical verdicts that reach millions of viewers (plus a private jet and army of trolls, according to the New York Times).
But influence and impact aren’t the same thing. Does a high score translate to actual business outcomes? Or is it just momentary internet fame?
We matched OneBite’s review database to Enigma’s business intelligence data—revenue transactions, foot traffic patterns, operating status—to measure what actually happens after a pizza place gets this high-profile review treatment. The results display how viral media creates measurable economic effects, and why some restaurants survive while others close.
The Value of a Top Review
The impact of impressing Portnoy is clear: restaurants scoring 8.0 or higher see revenue jump by an average of 90.2% in the six months following their review. That’s not a rounding error or a modest bump. It’s nearly doubling their business.
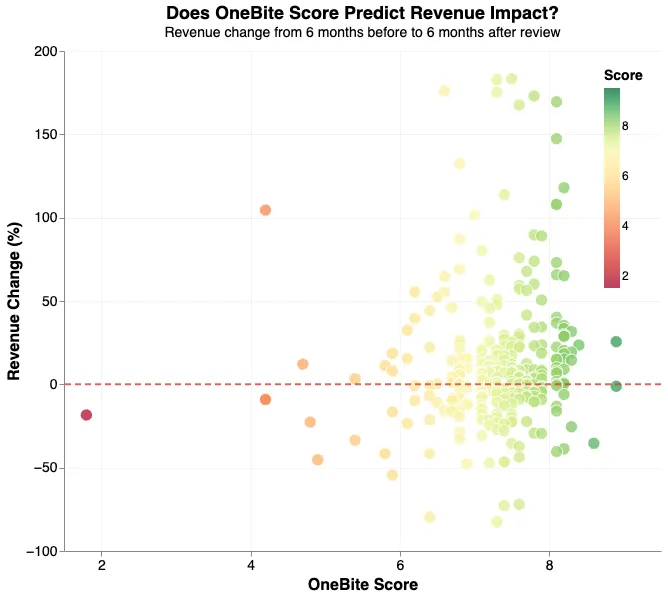
Even restaurants scoring in the 7.0-7.9 range—solidly above average—see a 17.1% revenue increase in the following six months. Across all scores, 60% of reviewed venues experience some level of revenue growth, averaging 30.8%. The timing is clear in our data: revenues tend to remain stable in the six months before a OneBite review, then spike immediately after the review video drops. The pattern repeats across hundreds of restaurants in different states, cities, and market conditions.
Foot traffic tells the same story. Daily customer counts jump by 68.9% on average after a OneBite review. A good score doesn’t just generate comments—it drives business. But this boost is not evenly distributed: only a slight majority of restaurants (54.3%) see more people walking through the door in the months that follow.
Geography: The Northeast vs. Everywhere Else
Onebite ratings have a clear geographic skew toward the Northeast—both in volume and high achievement. Connecticut leads these reviews with a 7.69 average score across 72 reviews. New Haven, famous for its coal-fired pies, averages 7.75—the highest-rated city with a meaningful sample size. The Northeast corridor forms a wall of excellence: Connecticut (7.69), New Jersey (7.47), Massachusetts (7.30). Yet this Northeast emphasis also belies Portnoy’s Boston origins, reflected in an unusual concentration and high evaluation of Massachusetts eateries.
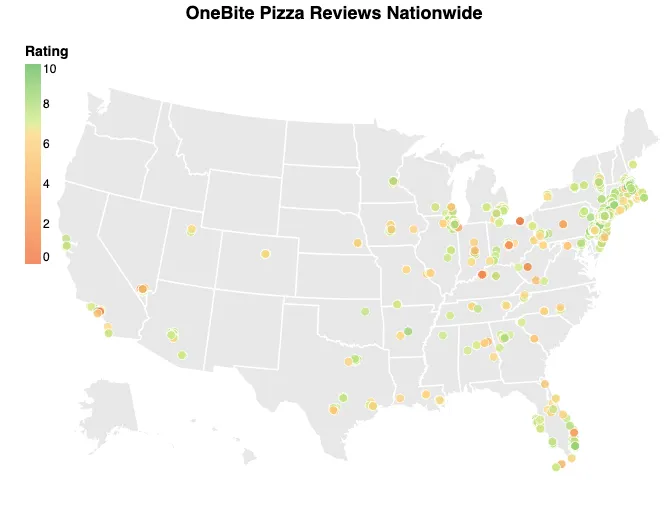
Then there’s the rest of the country. Kentucky averages 5.43. Alabama: 5.84. West Virginia: 5.87. The gap between Connecticut and Kentucky isn’t marginal—it’s a chasm that spans the entire rating scale. But Kentucky’s problems go deeper than low scores. It’s also the most inconsistent state (standard deviation: 2.71). To go by these OneBite ratings, you’re just as likely to find decent pizza as you are to find something that barely qualifies as food.
Meanwhile, Maryland and Arizona prove the Northeast doesn’t have a monopoly on quality. Both states maintain high scores and consistency—reliably good pizza for states that rarely attract this reputation. Despite these few surprises, pizza quality concentrates in regions with generational knowledge, ingredient access, and cultural standards
New York City: A Varied Pizza Landscape
OneBite has reviewed 78 venues in Brooklyn with an average score of 7.67. No other location in our dataset comes close to combining that much volume with such high quality. Plenty of cities have a handful of excellent shops. Plenty have a wide selection of average ones. Brooklyn is the only market that’s both majorly represented in OneBite reviews and also consistently good, with dozens of highly rated pizzerias.
Across the Verrazano Bridge, Staten Island edges Brooklyn slightly in average score (7.73), but with less than a quarter of Brooklyn’s review count. If you’re hunting for impressive outliers, Staten Island is a solid bet for good pizza off the beaten path. But Manhattan is the inverse story: more volume, weaker scores. As the epicenter of the civilized universe, Manhattan has plenty of reviewed venues, but the ratings sag as you move into heavier tourist zones and high-rent neighborhoods where pizza is optimized for foot traffic and convenience. There’s a clear tradeoff in the numbers for Manhattan pizza: volume and ease of access over peak quality.
The Extremes: Perfect Tens and Absolute Zeros
Extremes often make the best stories. At the high end of OneBite ratings, Monte’s Restaurant in Lynn, Massachusetts achieved a perfect 10, suggesting that this small city north of Boston is a hidden mecca of pizza excellence. Trailing just behind are DeLucia’s Brick Oven Pizza (New Jersey), Frank Pepe’s (New Haven), and Di Fara (Brooklyn) each earned 9.4 ratings. Then there are the lowest achievers. At the bottom: Café Muse (New York) and Blaze Pizza (Los Angeles) both received 0.0 scores. These are zeroes. Not “bad,” not “disappointing.” Zero.
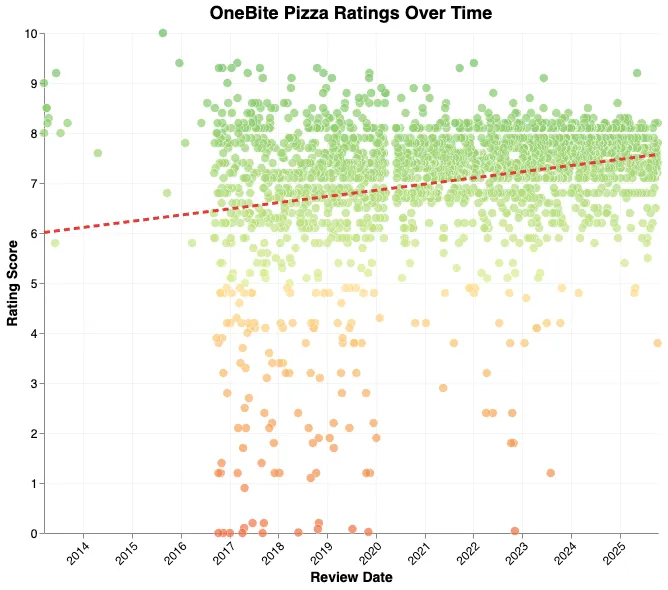
In terms of general trends, the median score across all OneBite reviews is 7.3, meaning half of all pizza ratings fall below this threshold. The scale is genuinely harsh. A 7.0 isn’t mediocre—it’s a solid B in a system where C’s are common and F’s are plentiful. This distribution matters because it shows the scores have real variance. If everything clustered around 7.5, the ratings would be meaningless. Instead, the full scale is in use, from perfection to catastrophe. Although plotting the ratings over time suggests that OneBite’s ratings are both trending upward and concentrating in the good-not-great range.
The Real Value of Reviews
Our analysis isn’t about one reviewer’s influence—it’s about how information asymmetry works in local restaurant markets. Before viral food media outlets like OneBite, finding quality pizza required local knowledge, word-of-mouth, and maybe a little trial and error. Meanwhile, many high-quality restaurants in secondary markets languished in obscurity, while many bad restaurants survived on location and inertia.
Widespread access to reviews can ameliorate that friction. These reviews surface quality, punish mediocrity, and accelerate market efficiency. And the effect is measurable using Enigma’s business data: revenue spikes, foot traffic surges, and closure rates correlate with scores.
The bump that comes with a OneBite review is what you get when millions of people have reliable information about local product quality. Then we can use data gathered about those businesses to measure what happens next. Connecticut makes some of the absolute best pizza in America. Kentucky seems to make the worst. Brooklyn pizzerias are the most reliable across the board. And viral media clearly sells a lot of slices and pies.
Methodology
Our analysis is based on 1,868 OneBite pizza reviews matched to business intelligence data (revenue, foot traffic, operating status) from 2013-2025.
Non-pizza establishments (like McDonald’s and Panera Bread) have been filtered out along with data anomalies (such as businesses with strikingly low levels of card revenue, which are probably cash only).
We measured revenue impact by comparing 6-month averages before and after review dates.
Coverage: 38 states, 567 cities (foreign businesses, mostly in Italy and Canada, have been filtered out).