How to Identify a Future Unicorn (Before Your Competitors)

Halfway through 2021, small business lenders and investors are all asking themselves the same question: “How can I identify opportunities for growth without increasing risk?”
The U.S. economy is rebounding rapidly with 6.5% growth in the second quarter of 2021. For lenders, the recovery represents an opportunity to expand their portfolio. Lenders who are the first to identify growing businesses will be poised to gain market share.
Lenders who are the first to identify growing businesses will be poised to gain market share.
However, the dearth of reliable data about small businesses makes early identification of growing businesses a challenge. By the time there are publicly available markers of growth, like press releases or fundraising rounds, you’ve lost the edge and competition has increased.
Revenue growth can be a leading indicator of small business growth. To highlight how this data can be used by both small business lenders and institutional investors, we looked at two companies in different industries and growth stages.
Company 1: Direct-to-consumer apparel
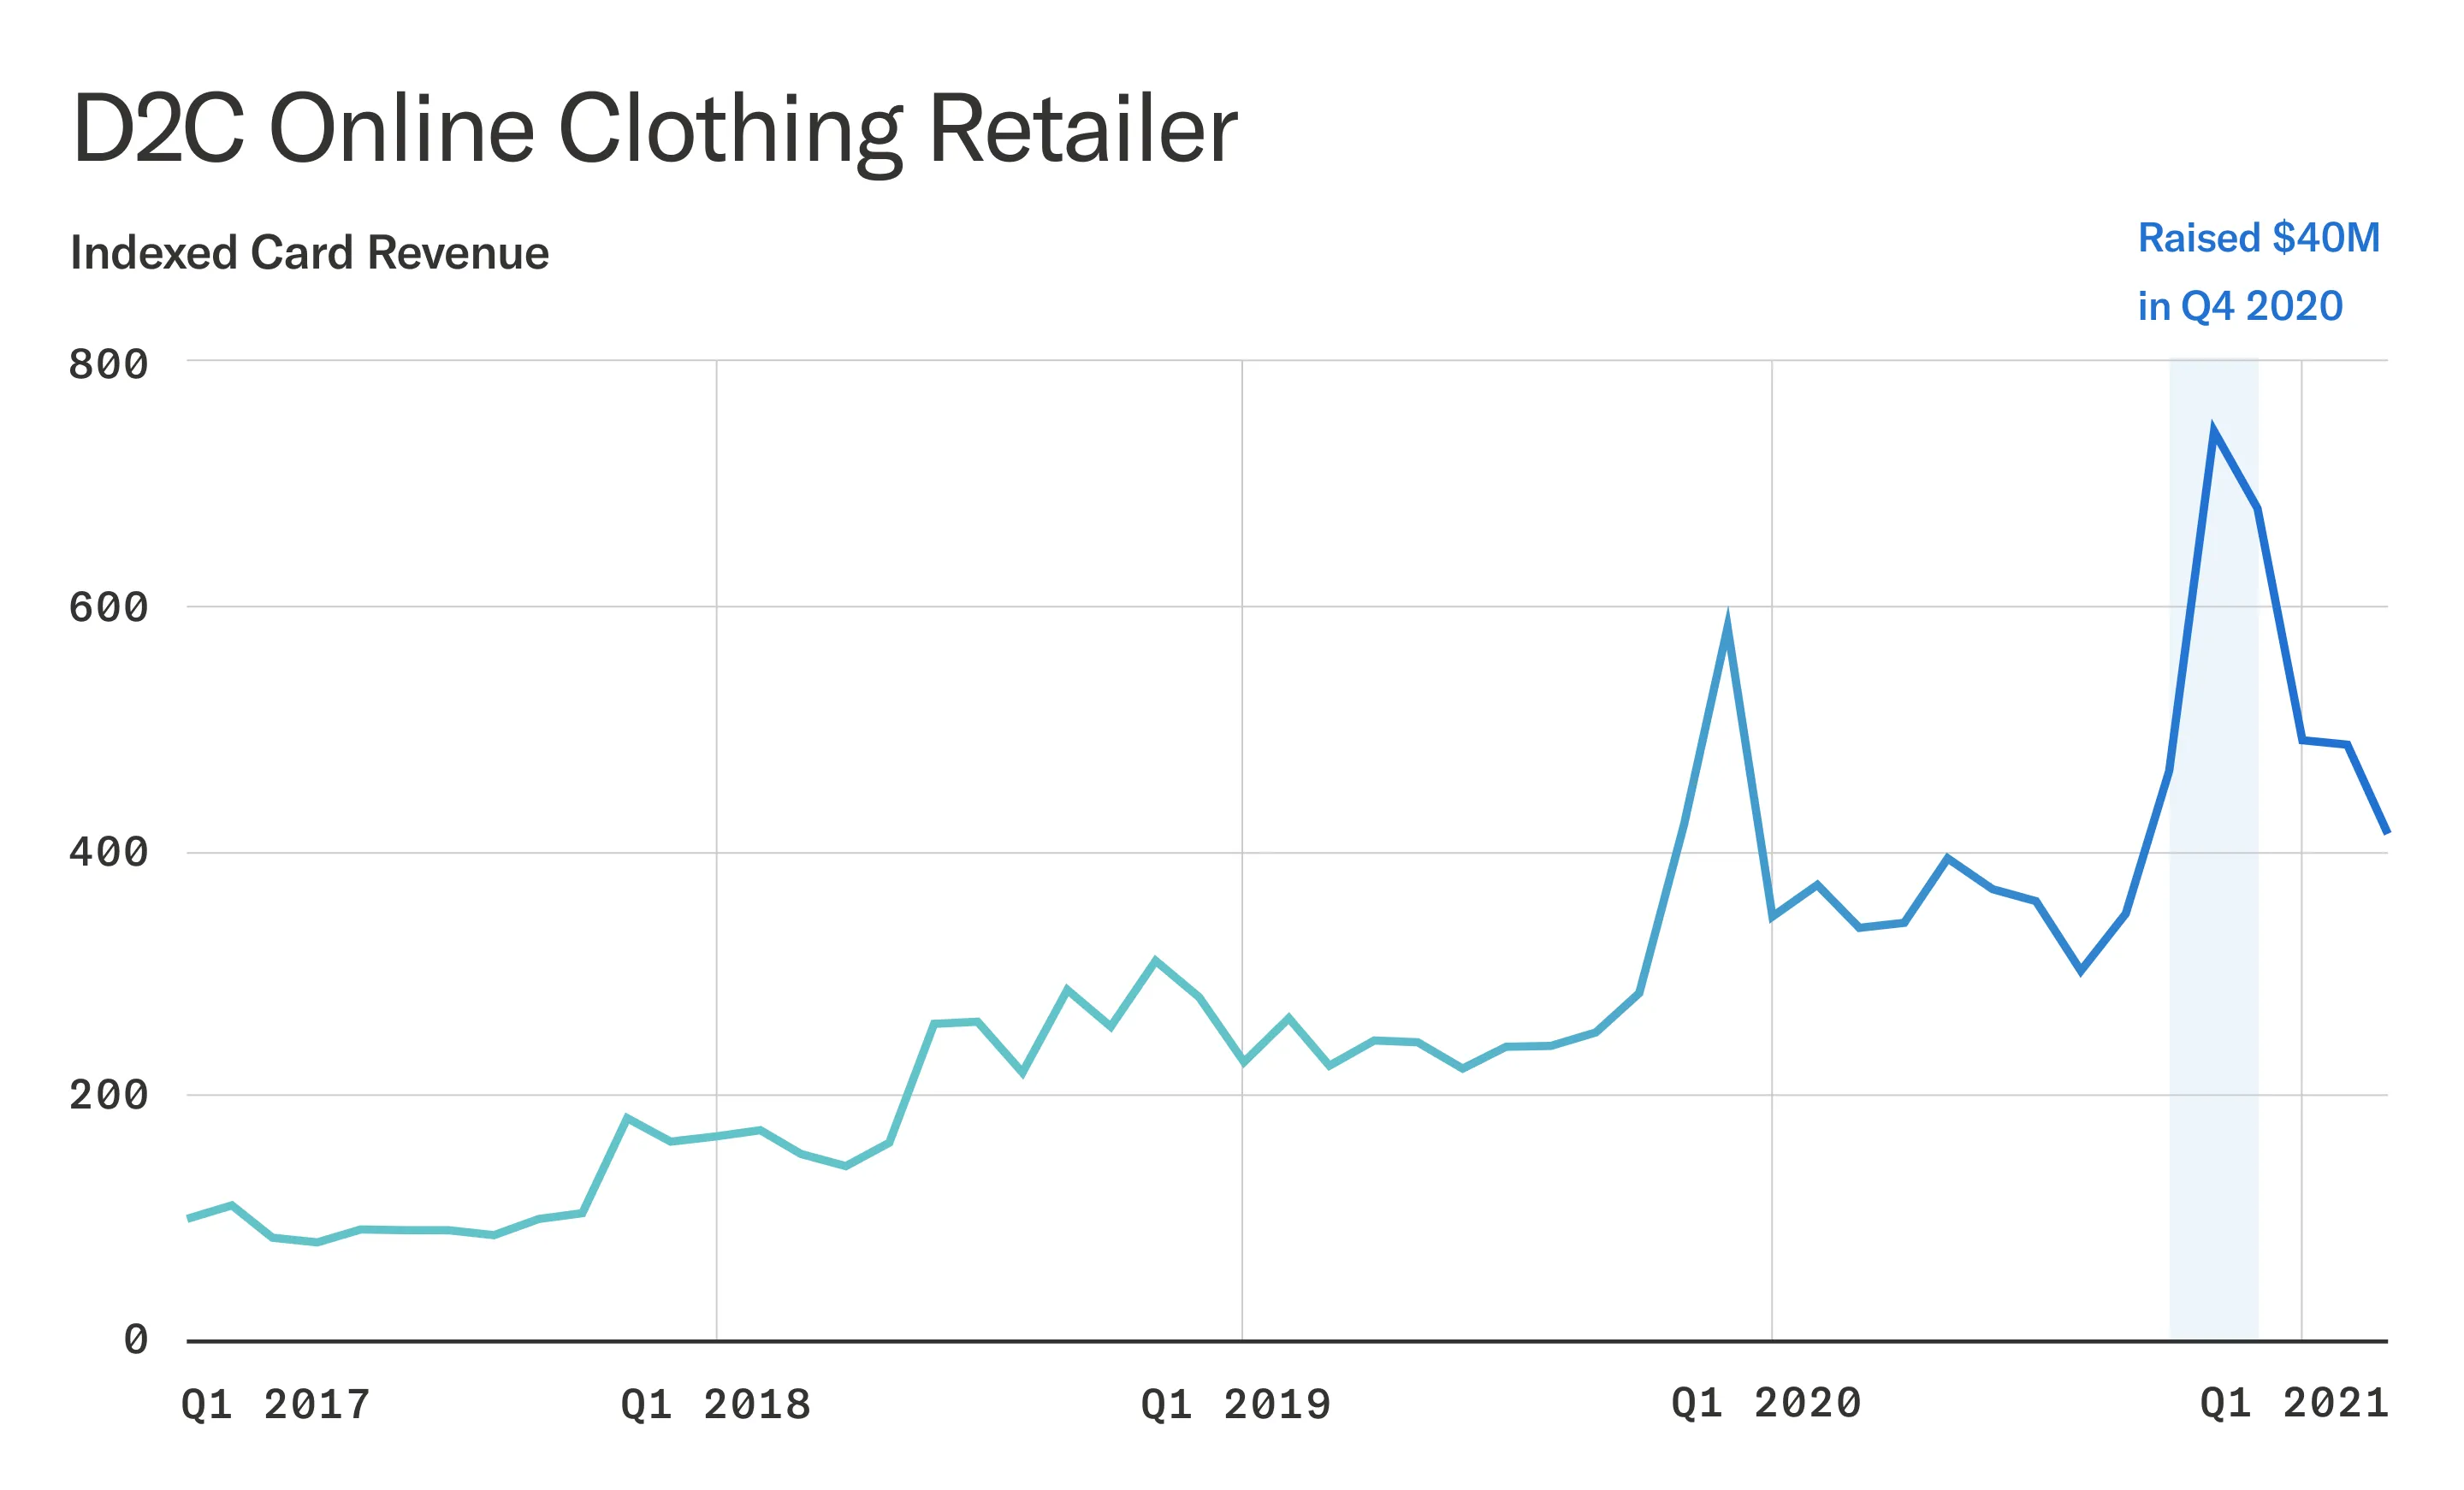
Company 1 is a direct-to-consumer online apparel company that saw slow but steady growth from 2017 to 2019. In the second half of 2019, we see a sharp spike in revenues aligning with the winter holidays. In Q1 2020, monthly card revenues were almost 100% higher year-over-year. At the end of 2020, they again hit record revenue growth and raised $40 million in funding. Enigma’s card revenue data was able to show an acceleration in revenue growth more than a year before the fundraising round.
Company 2: Alcohol delivery start-up
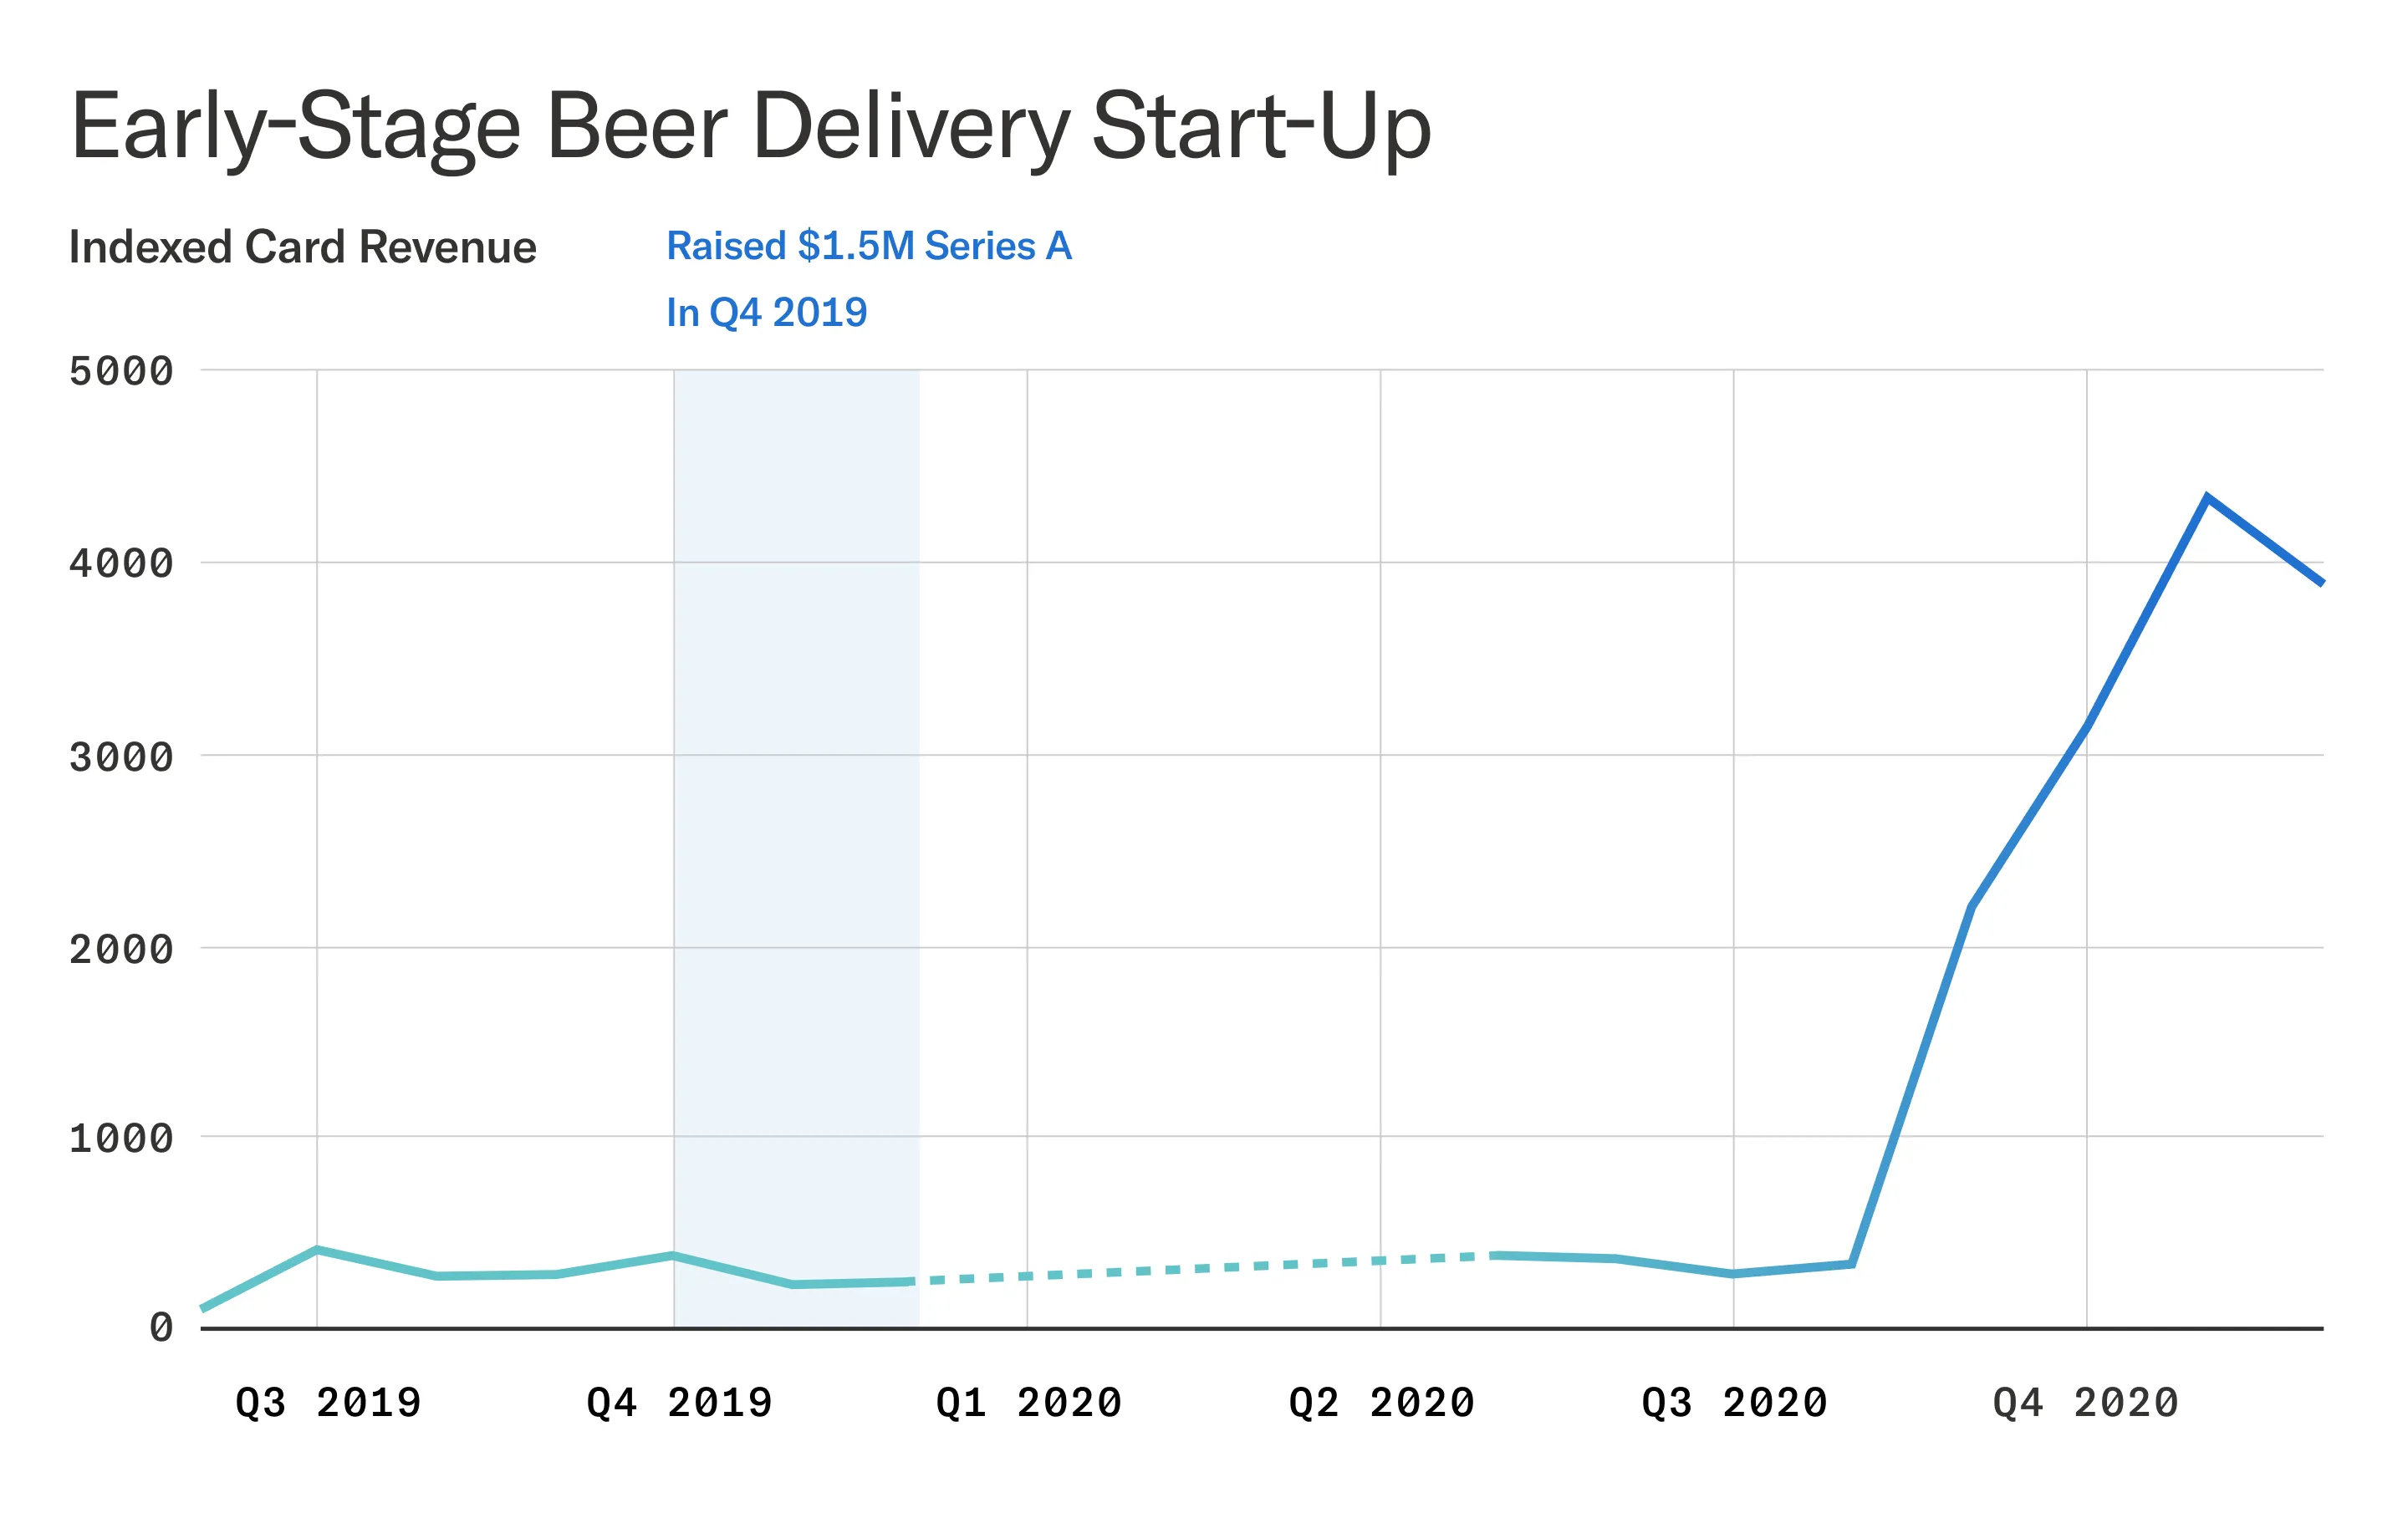
Company 2 is an early-stage alcohol delivery start-up founded in 2019. The company didn’t see much growth in their first year as they built out their team and product. In the second half of 2020, however, revenues rose rapidly as the company was well-positioned to meet new demand triggered by the pandemic. In June of 2021, the company raised another round of funding. Enigma was able to flag a sharp uptick in revenue growth significantly earlier, enabling strategic relationship building and credit line increases to occur before competition arrived.
Incorporating card revenues and growth data into your process
The above two examples show how an acceleration in card revenues growth can be a leading indicator of business success and funding events. The best way to incorporate this data depends on your use case and current process.
Small business lenders often find this data is orthogonal to their existing sources and integrate it into their models. Investors may find it more helpful to use triggers and identify businesses whose growth rate crosses key thresholds.
Get in touch to discuss how Enigma’s revenues and growth data can help your organization.