The Holiday Spending Cycle

Everyone knows December is the peak holiday shopping season—and for most retailers, that’s true. Electronics stores see revenues surge +165%, jewelry retailers jump +84%, and gift shops boom +67%.
But while retail shops overflow with shoppers, a different story unfolds across town: hotels sit half-empty (-25%), movie theaters go dark (-75%), and casinos struggle (-69%). America’s holiday spending patterns aren’t just seasonal — they’re bifurcated, with some industries soaring while others crash.
And the real surprise? The January-February post-holiday reckoning hits both groups: gift retailers see their gains evaporate in a brutal revenue crash, while hospitality and entertainment struggle to recover from their December slump.
Enigma’s data reveals a nuanced picture of how American spending patterns shift across the calendar year — and it challenges some conventional assumptions about when and where consumers actually spend the most.
Using transaction data covering 410,001 holiday-sensitive businesses across the United States during the five years spanning 2020 through 2024, we analyzed monthly spending patterns to understand the true economics of seasonal retail. What we found offers a revealing picture of America’s annual spending cycles.
December’s Surge — In Context
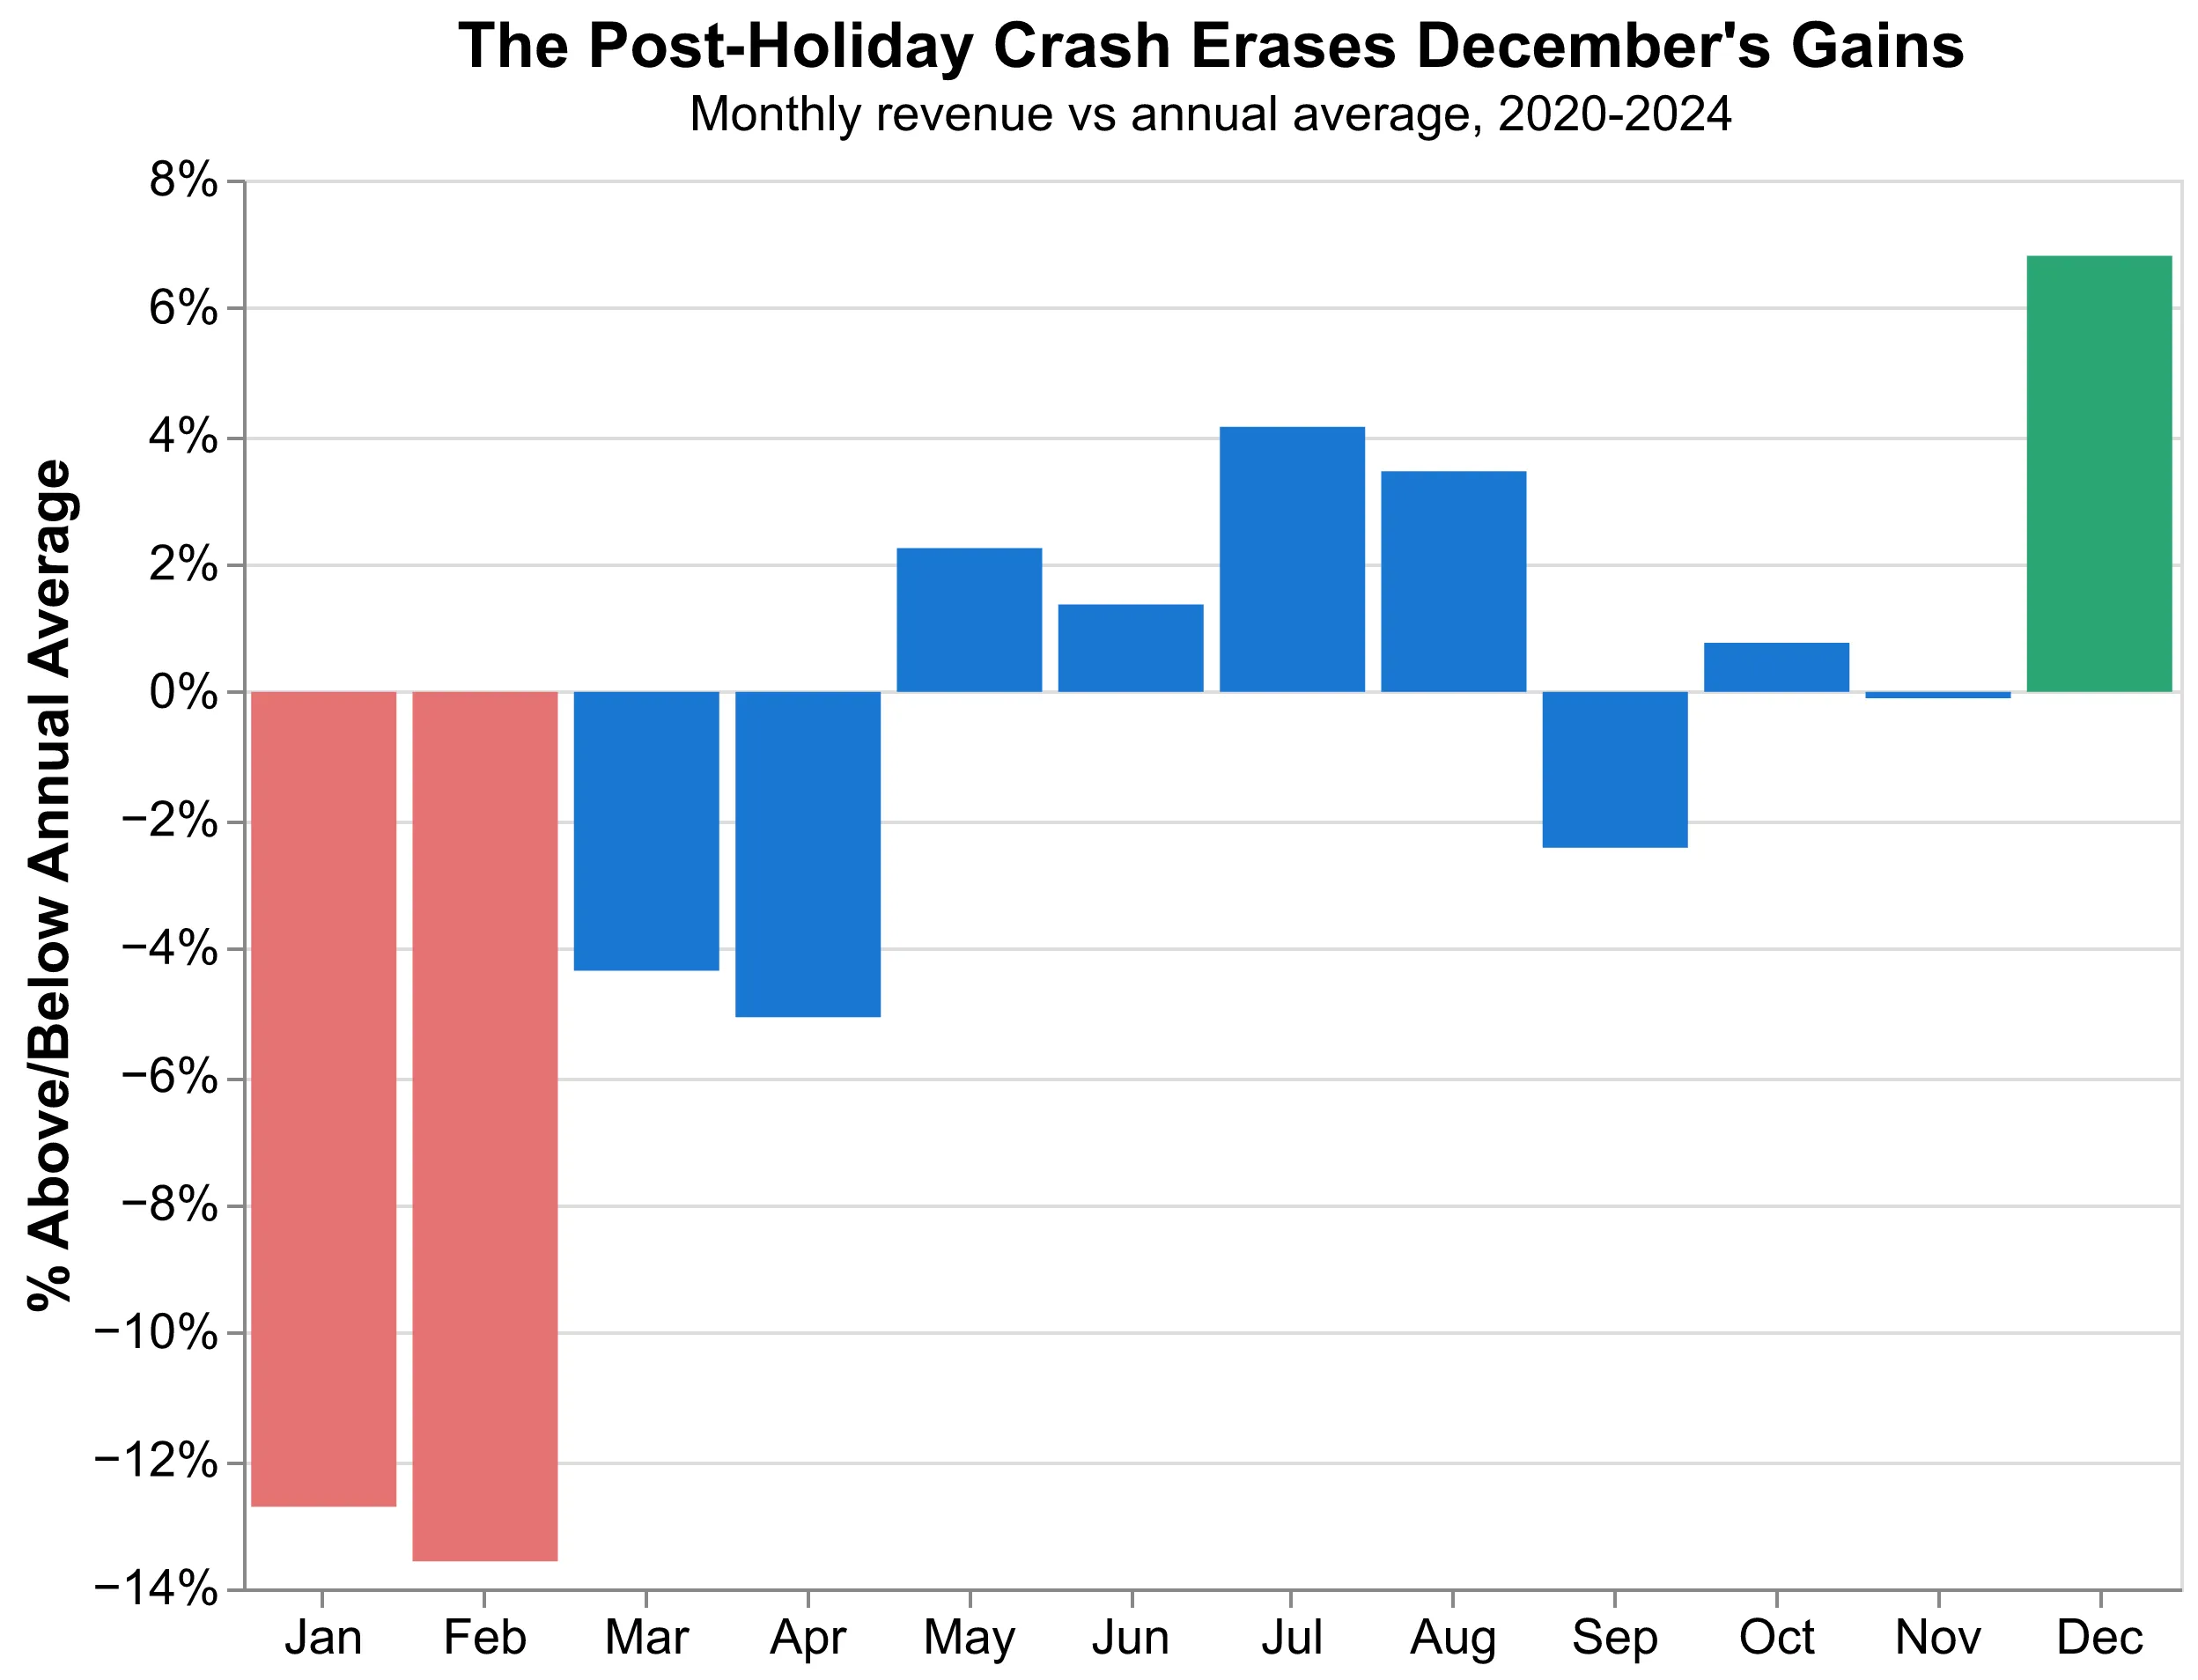
The December spending spike is real. From 2020 to 2024, December revenue in holiday-sensitive industries averaged 8.9% above the monthly average, with transaction counts up 3.2%. That’s $349.8 billion in December revenue in 2024 alone.
Then comes the post-Holiday slump: spending follows a predictable pattern when consumers reset their budgets in January and February. Revenue in holiday-sensitive industries runs -13.2% below the annual monthly average. This isn’t a collapse — it’s a natural recalibration after December’s elevated spending. Consumers who splurged on gifts and celebrations in December naturally scale back in the following months.
The full picture:
- December boost: +8.9% for one month
- January-February adjustment: -13.2% for two months
- Annual pattern: Spending concentrates in December and summer, moderates in winter and spring
Retailers who understand this full cycle — rather than focusing solely on December — can better plan inventory, staffing, and promotions throughout the year. The January-February slowdown is a regular pattern to anticipate.
Where the Holidays Hit Hardest
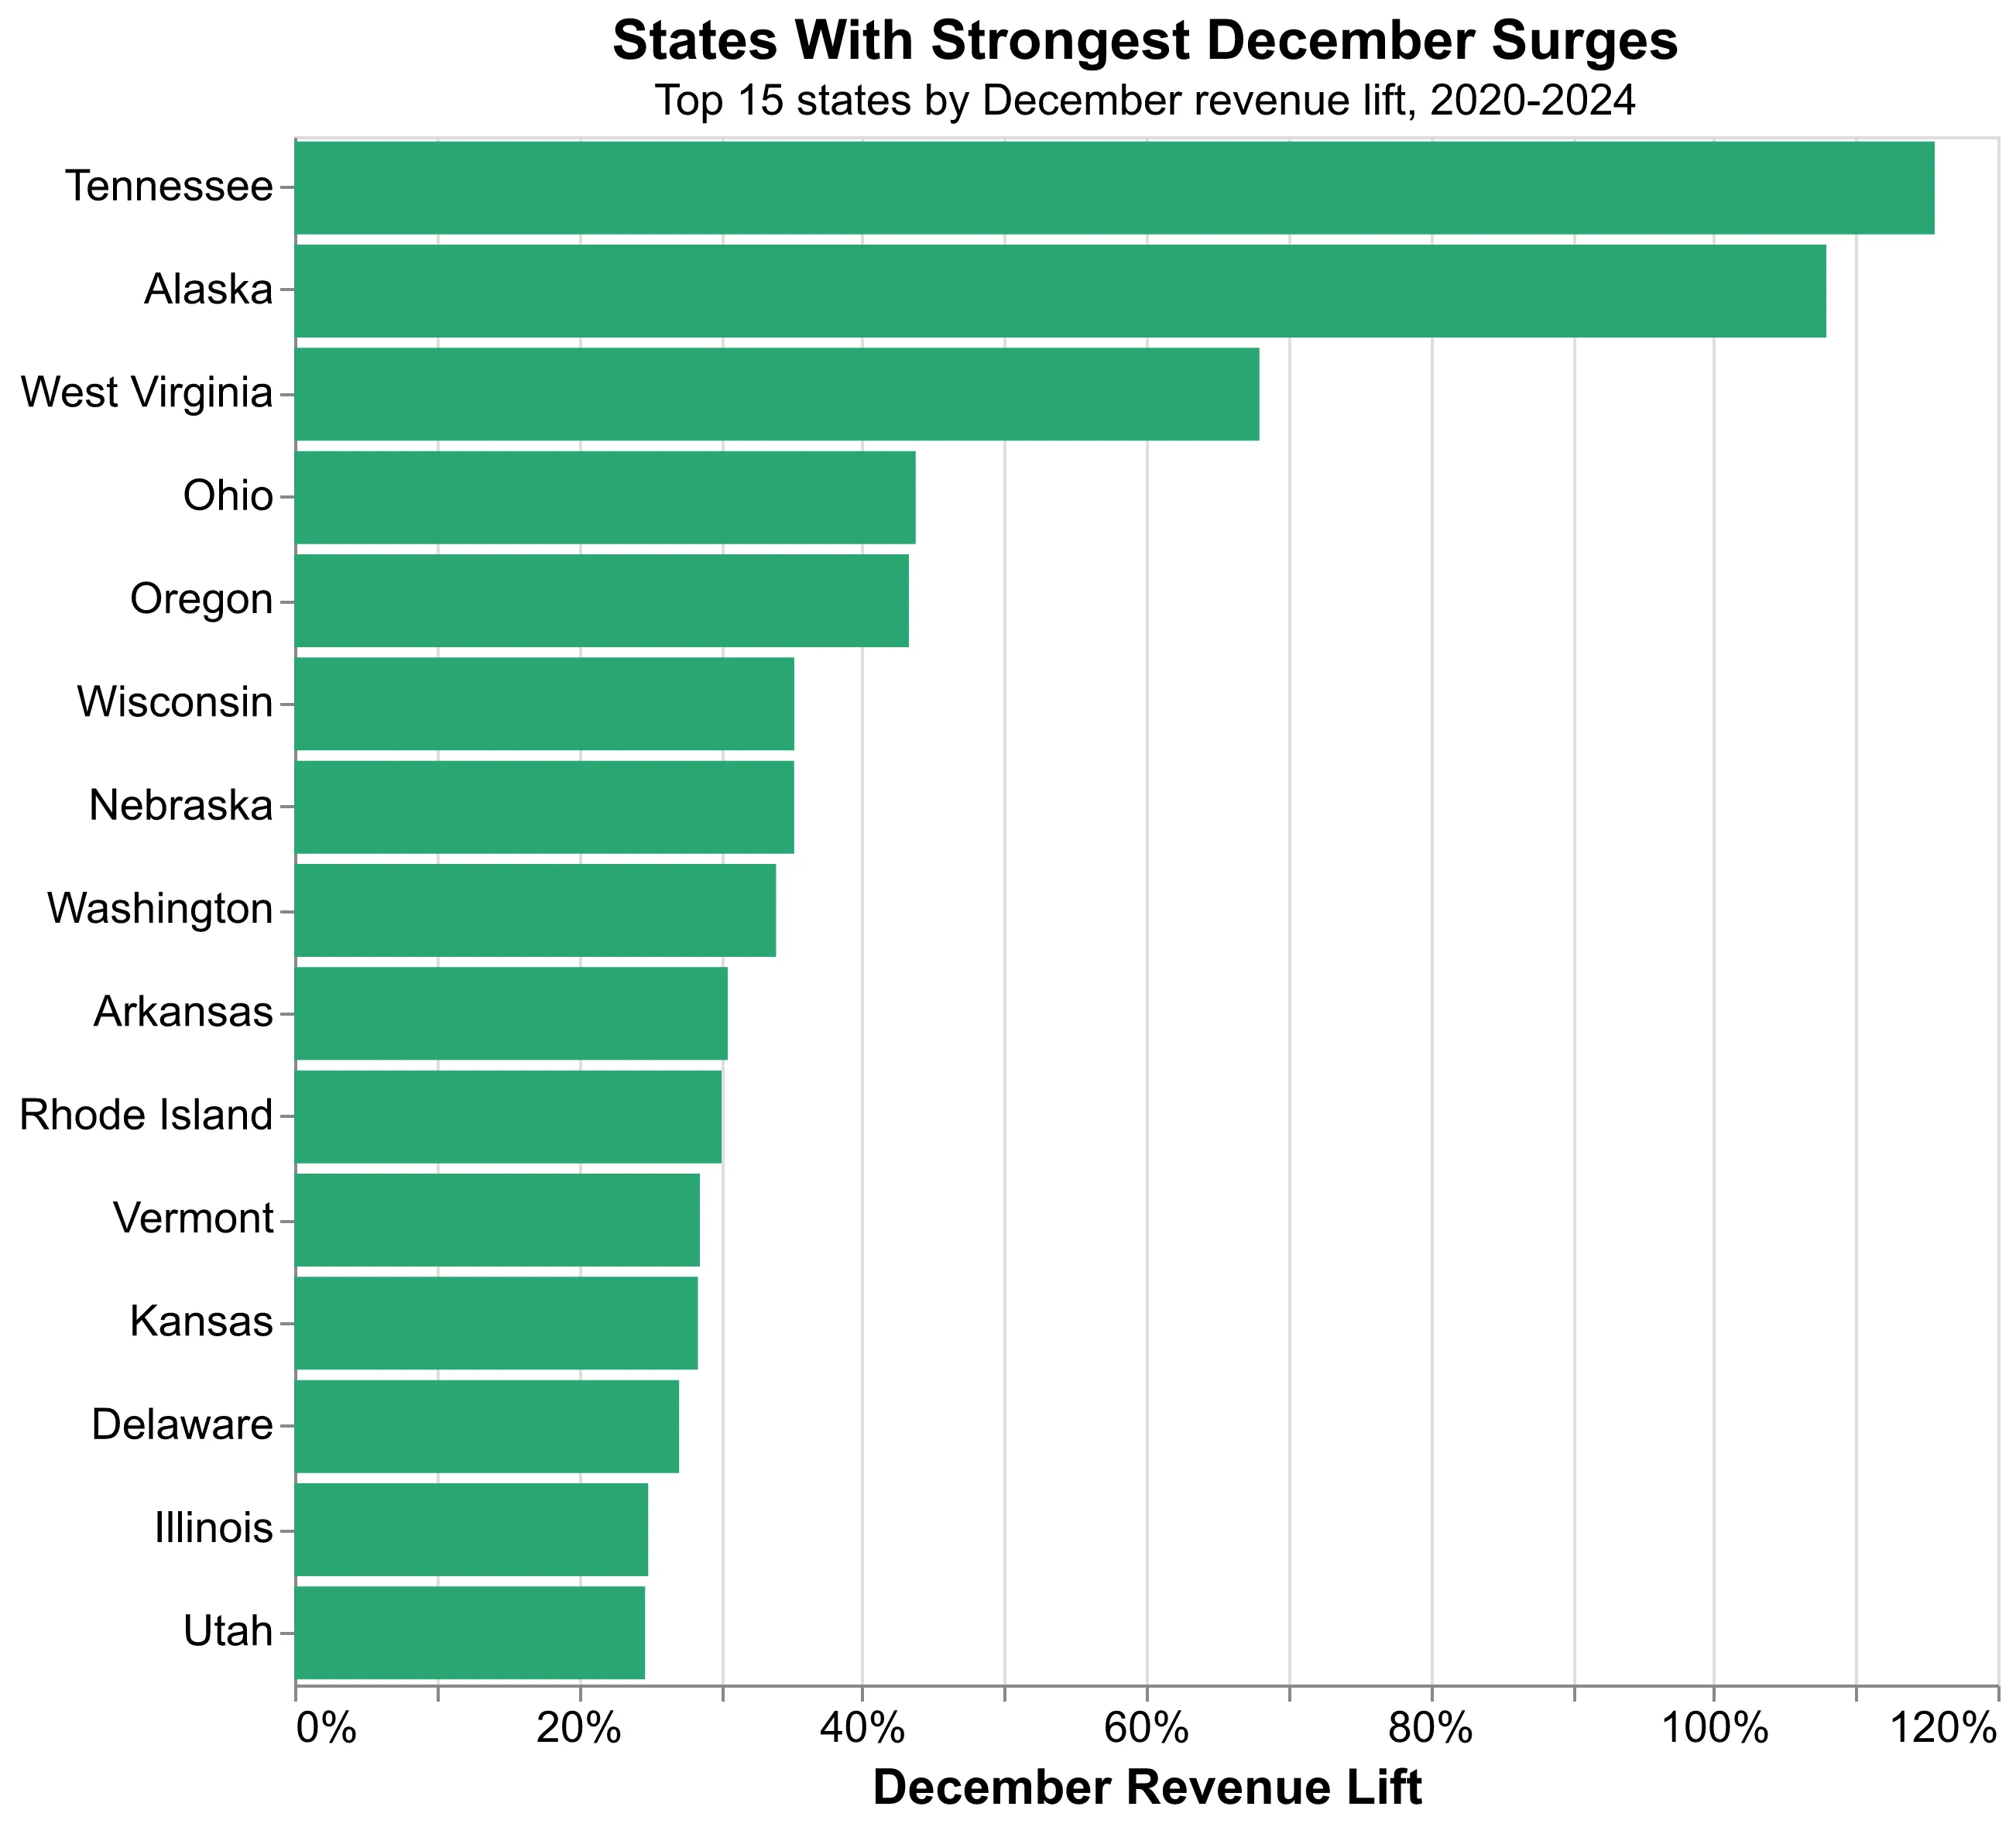
The December surge and January slowdown vary dramatically by geography, revealing fundamental differences in local economies.
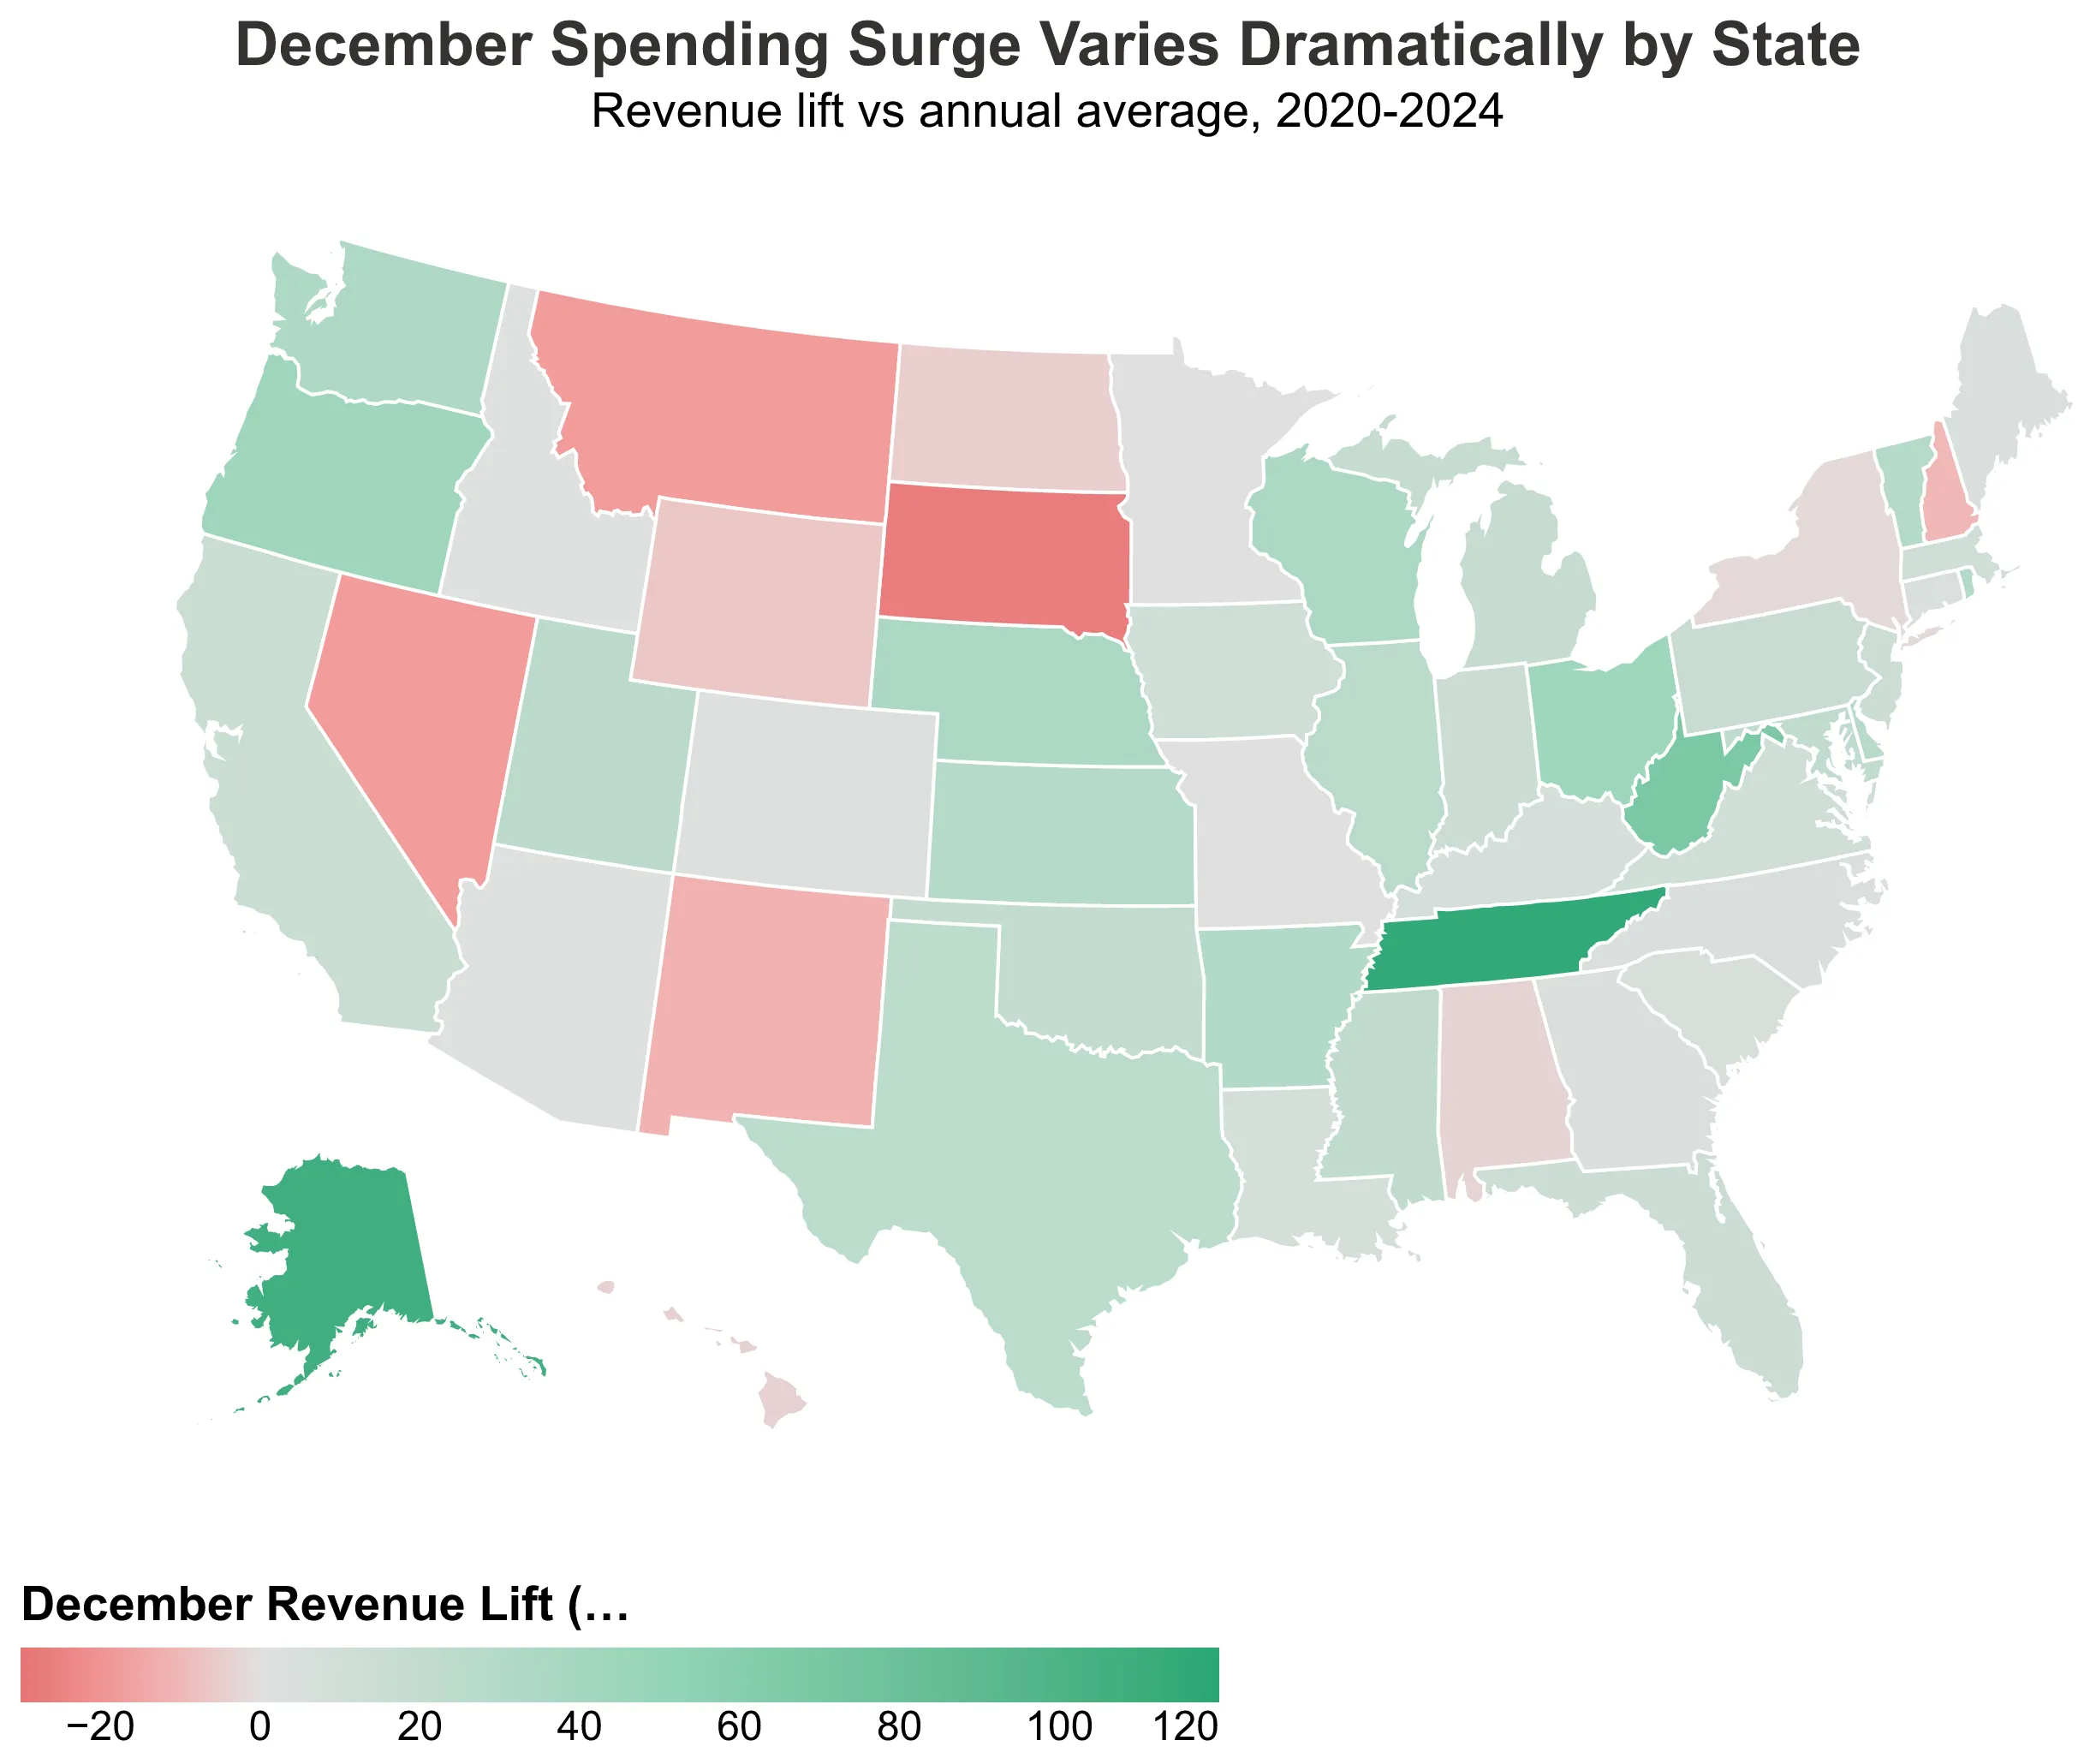
Top states by December revenue lift (2020-2024 average):
- Tennessee: +115.6%
- Alaska: +107.9%
- West Virginia: +68.0%
Meanwhile, states like California and Texas show December lifts of just 15-20%, suggesting more stable year-round spending patterns.
What drives these differences? The pattern defies conventional wisdom. Suburban retail hubs like Plano, TX and Arlington, VA see massive December lifts of +155% and +128% respectively, as residents flock to shopping centers for holiday purchases. Meanwhile, major tourism destinations like Las Vegas and Orlando actually see December declines of -14% and -9%, suggesting holiday travelers stay home with family rather than visiting entertainment capitals.
Industries With the Strongest Holiday Patterns
Some industries ride the holiday wave. Others maintain steady rhythms regardless of the calendar.
Biggest December winners (industries with highest December lift):
- Electronics and Appliance Retailers: +165.1%
- Sporting Goods, Hobby, Musical Instrument, and Book Retailers: +92.9%
- Jewelry Retailers: +83.7%
- Gift, Novelty, and Souvenir Retailers: +67.1%
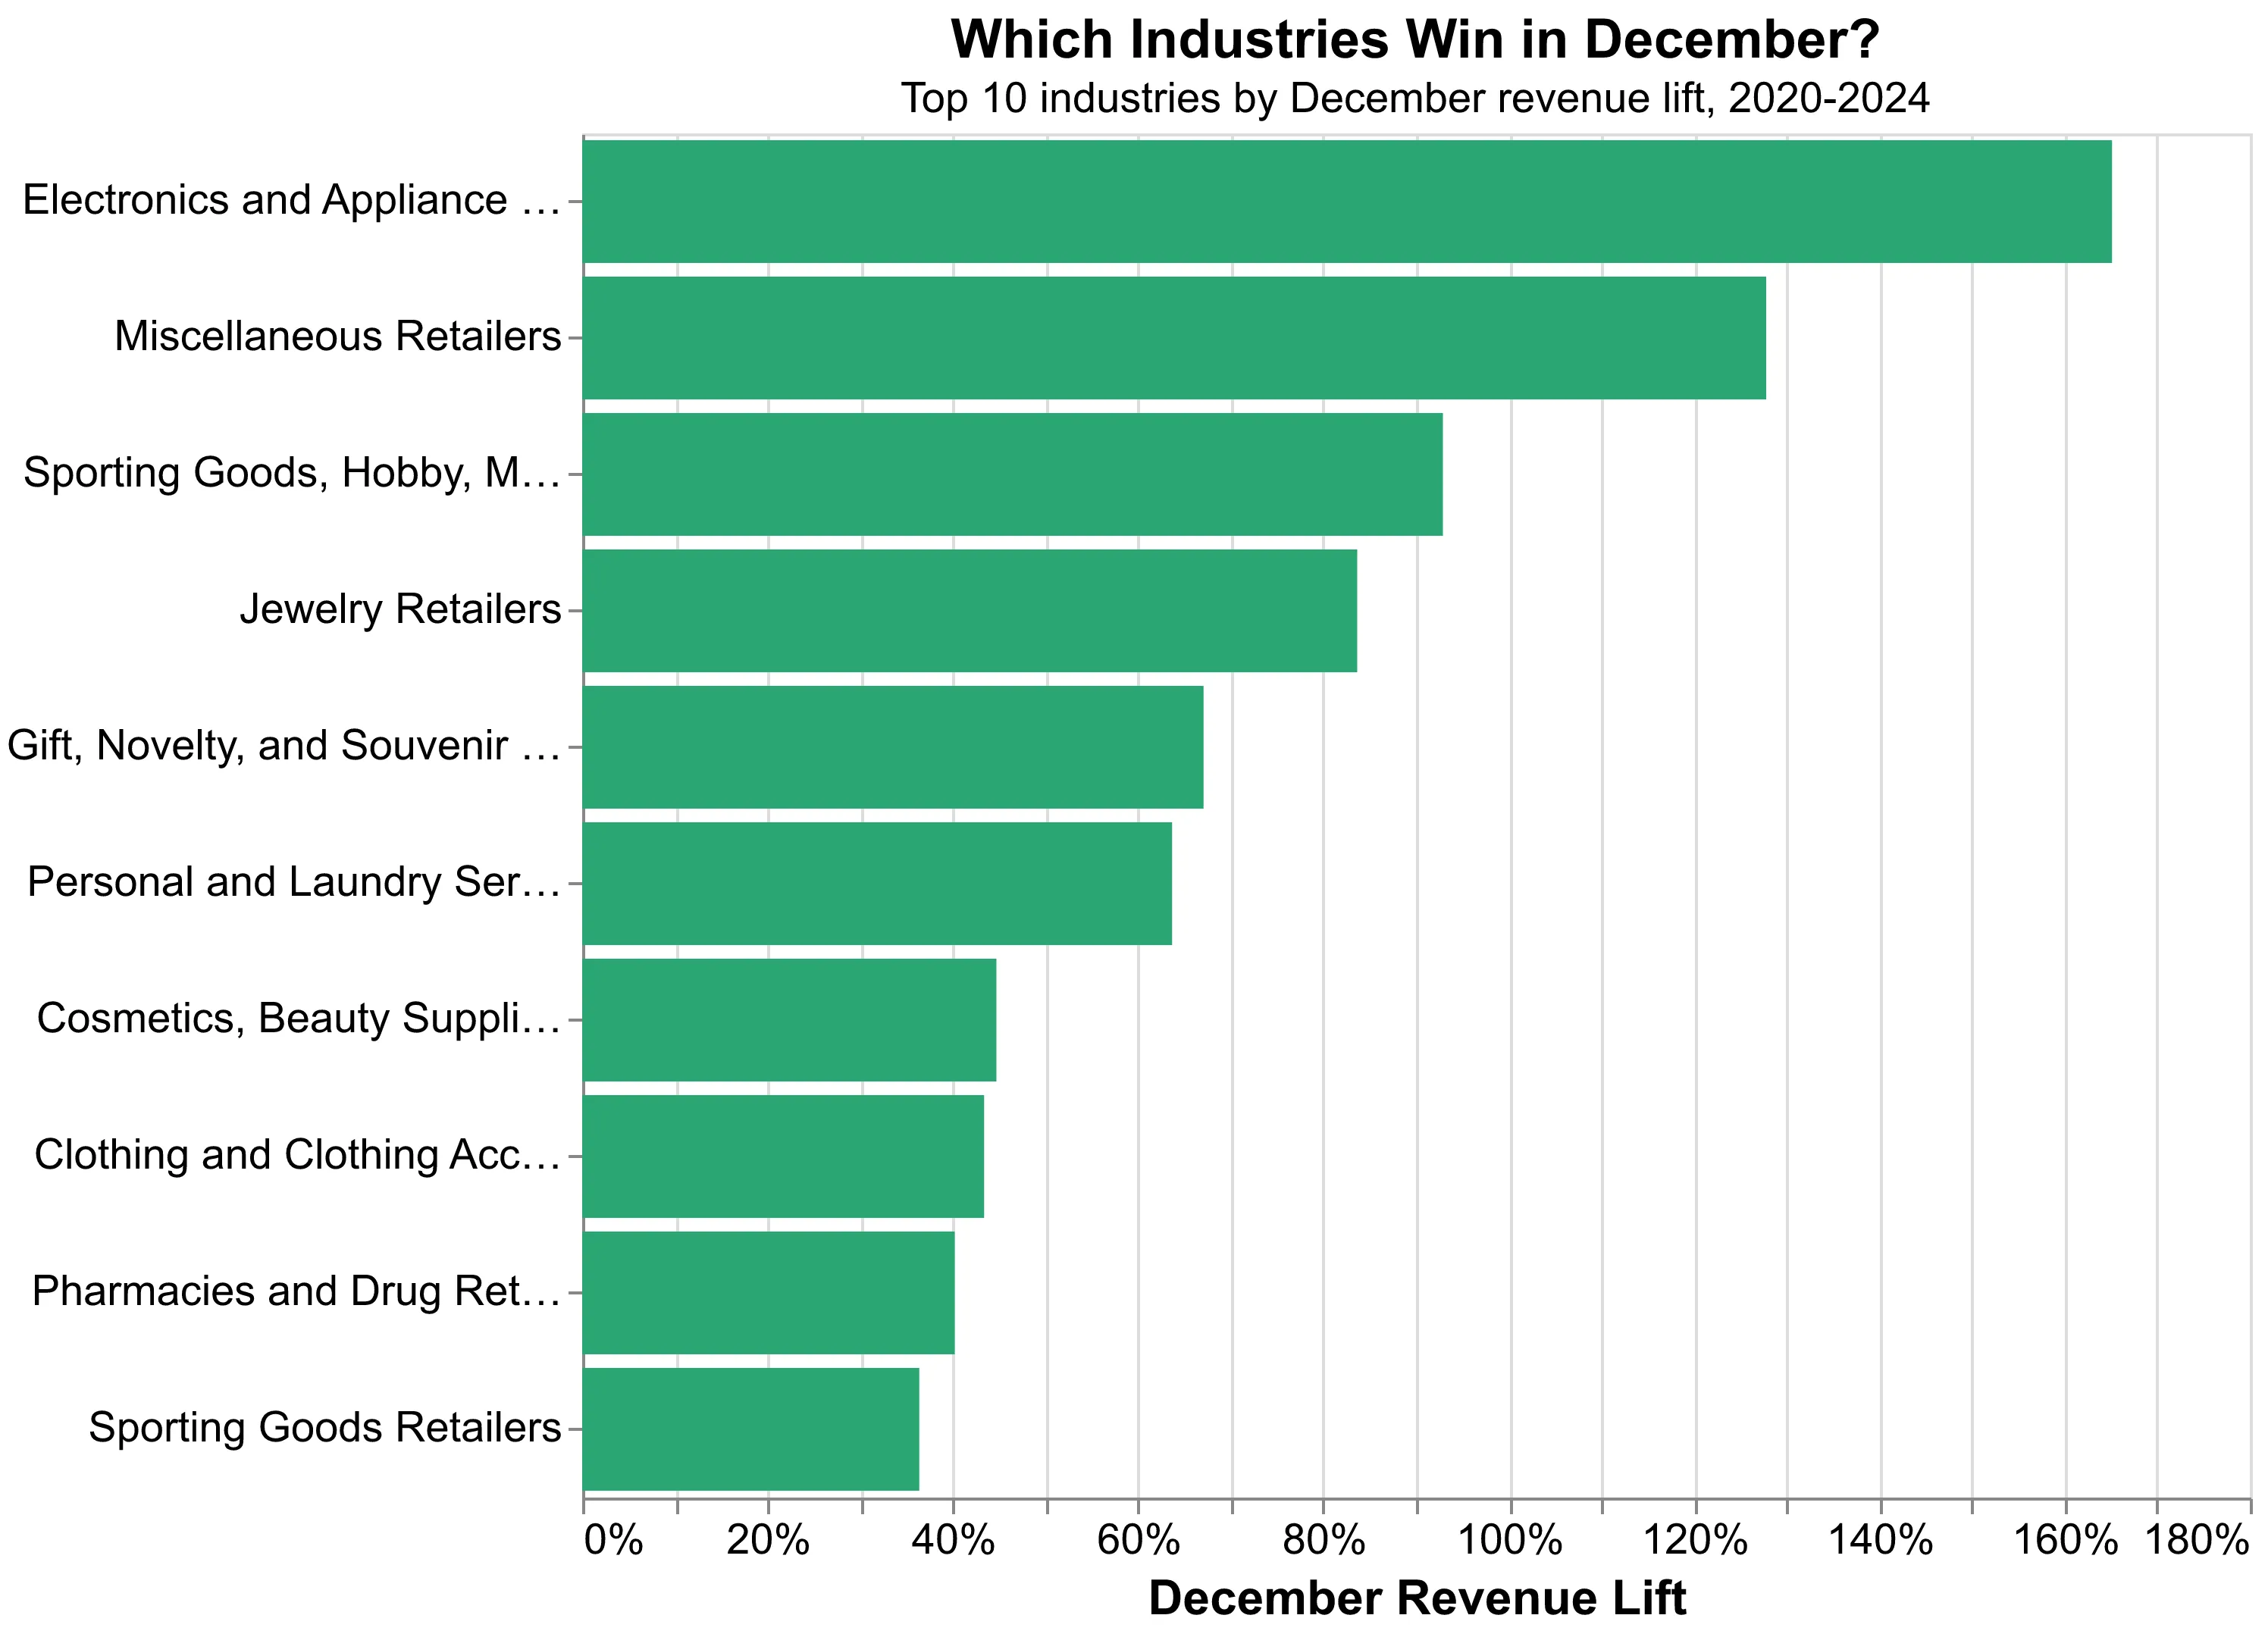
Jewelry retailers, gift shops, and specialty stores see predictable December surges tied to gift-giving traditions. But the data also reveals surprises: personal care and beauty services see a +64% December lift — salons and spas benefit from holiday party preparations and gift certificate purchases. Meanwhile, pharmacies see a +40% boost, likely driven by seasonal cold and flu medication needs.
Industries with minimal seasonal variation:
- Limited-Service Restaurants: 0.0%
- Convenience Stores: -1.5%
- Supermarkets and Grocery Stores: +11.7%
Some sectors — particularly essential services like fast food, convenience stores, and grocery — show minimal December fluctuation, demonstrating stable baseline demand that resists seasonal shifts. These industries benefit from predictable revenue streams year-round.
The industries with the strongest December peaks also tend to see the sharpest January declines. Electronics retailers (+165% in December) and jewelry stores (+84%) face the steepest post-holiday crashes as gift-buying ends abruptly. In contrast, accommodation and entertainment industries that decline in December (-90% and -69% respectively) see January recoveries as travelers return and normal leisure spending resumes. This creates planning challenges but also opportunities for retailers who can anticipate and prepare for these swings.
Some sectors — particularly essential services, grocery, and everyday necessities — show minimal December fluctuation, demonstrating stable baseline demand that resists seasonal shifts. These industries benefit from predictable revenue streams year-round.
But the data also reveals surprises: personal care and beauty services see a +64% December lift — nearly matching jewelry retailers. Holiday party season drives demand for salon appointments, spa treatments, and gift certificates. Beauty salons (+14%) and nail salons (+12%) see steady December booms as consumers prepare for celebrations and purchase pampering experiences as gifts.
The Counter-Cyclical Exception
Not every industry rides the December wave. Some sectors see dramatic declines as consumer behavior shifts:
December losers (industries that drop in December):
- Accommodation: -90%
- Motion Picture and Sound Recording: -75%
- Amusement, Gambling, and Recreation: -69%
- Hotels and Motels: -25%
Why the crash? During the holidays, Americans stay home with family rather than traveling for leisure or entertainment. Las Vegas casinos, movie theaters, and hotels see revenues plummet while gift shops boom. These industries face the opposite challenge: surviving a December slump before January recoveries.
For accommodation and entertainment businesses, the “holiday season” isn’t a peak — it’s a trough to weather.
The Full Picture
Yes, December is the holiday shopping season. Revenue surges, driven by gift-giving traditions and year-end celebrations. But zoom out and you’ll see summer months consistently outperform December in absolute dollars, and January-February’s decline is a predictable recalibration, not a crisis. That’s the real story of American retail: not a single make-or-break month, but a predictable cycle of seasonal spending patterns.
Methodology
This analysis uses Enigma’s proprietary transaction data covering 410,001 operating locations in 105 holiday-sensitive industries from January 2020 through December 2024. Industries include retail (clothing, electronics, jewelry, gifts, general merchandise), food and beverage (restaurants, bars), accommodation (hotels), entertainment, and personal services. We focused on businesses where holiday shopping behavior drives significant seasonal variation.
Monthly revenue lift calculated as the percentage deviation from annual monthly average. State and city analyses filtered to major markets with sufficient data coverage. All dollar figures inflation-adjusted to 2024 levels.